Monitoring your production is the cornerstone of an effective modern computer system, and at Zenaton we understand that our customers want to have as much information as possible regarding their various tasks and workflows. In this regard, the Zenaton dashboard itself offers some very useful performance indicators.
If you want to audit how things are going on on your servers, another source of information is the pair of files zenaton.out and zenaton.err created automatically when you run the zenaton listen command. They contain respectively whatever data your tasks and workflows write in the standard output and error of your system.
While those files are useful, they are not always simple to consult since a production server is not meant to be widely available for anybody to access. We’ve had recently some feedback that many of you wish to have a possibility to incorporate those files into their favorite performance monitoring solution.
Note that we have plans to add a live tail of the content of those files on the Zenaton website itself, but we have no ETA to disclose yet.
In this article, I am going to show you how to forward the contents of the Zenaton log files into two of the most commonly used performance monitoring systems: Datadog and the ELK stack.
Datadog
I will assume that you have already installed the Datadog Agent on your machine.
Locate the Datadog configuration file (mine was in /etc/datadog-agent/datadog.yaml), and if it’s not already done, un-comment the logs_enabled line and set its value to true (it is false by default on a fresh install).
Then locate your Datadog Agent configuration directory, add a sub folder named zenaton.d in it, and in this new folder, add a file named conf.yaml.
You might have to set the permissions on those new folder and file so that the
dd-agentuser and thedd-agentgroup have access to them.
In the new conf.yaml file, copy/paste the following:
logs:
  - type: file
    path: /PATH_TO_YOUR_ZENATON_WORKER/zenaton.out
    service: NAME_OF_YOUR_DATADOG_SERVICE
    source: custom
  - type: file
    path: /PATH_TO_YOUR_ZENATON_WORKER/zenaton.err
    service: NAME_OF_YOUR_DATADOG_SERVICE
    source: custom
Don’t forget to update PATH_TO_YOUR_ZENATON_WORKER with the absolute path where lies the files you use to execute Zenaton tasks and workflows (by default where your Zenaton boot file is). The same goes for the name of your Datadog service (which will be created if it does not exist yet).
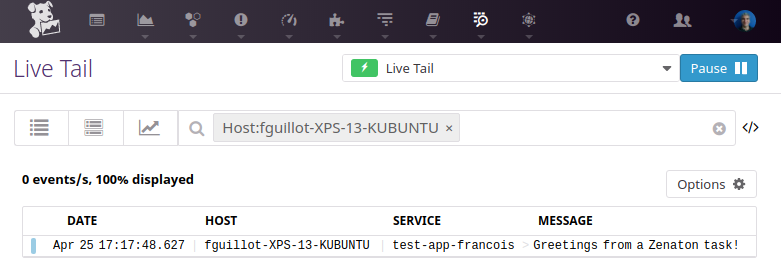
Finally, restart the Datadog Agent on the machine. And voilà! You should see the content of the Zenaton log files show up in your Datadog UI when there’s a change.

ELK
ELK stands for Elastic/Logstash/Kibana, Elastic being Elastic Search, the search optimized database, Logstash being the log oriented ETL, and Kibana being the user interface which plugs easily with Elastic Search.
Whether you have a self-hosted ELK stack or are using Elastic Cloud, I’ll leave the details of the installation to you and assume your infrastructure is up and running.
In order to forward the Zenaton log files to your ELK stack, we are going to use the tool of choice for such a task: Filebeat.
We are mostly going to follow their instructions. Using step 1, install Filebeat on the various machines acting as a Zenaton worker. Step 2 explains how to setup the filebeat.yml configuration file. This is where we are going to point our Zenaton log files for Filebeat to consume.
The relevant part should look like this:
filebeat.inputs:
- type: log
  enabled: true
  paths:
    #- /var/log/*.log
    #- c:\programdata\elasticsearch\logs\*
    - /PATH_TO_YOUR_ZENATON_WORKER/zenaton.out
    - /PATH_TO_YOUR_ZENATON_WORKER/zenaton.err
Just like with Datadog: don’t forget to update PATH_TO_YOUR_ZENATON_WORKER with the absolute path where lies the files you use to execute Zenaton tasks and workflows (by default where your Zenaton boot file is). Also don’t be like silly me: remember to set enabled to true (it’s false by default).
Follow the rest of step 2 to configure in filebeat.yml how to connect to your ELK stack, whether it’s self-hosted or in the cloud. Step 6 will tell you how to start the Filebeat service depending on your system.
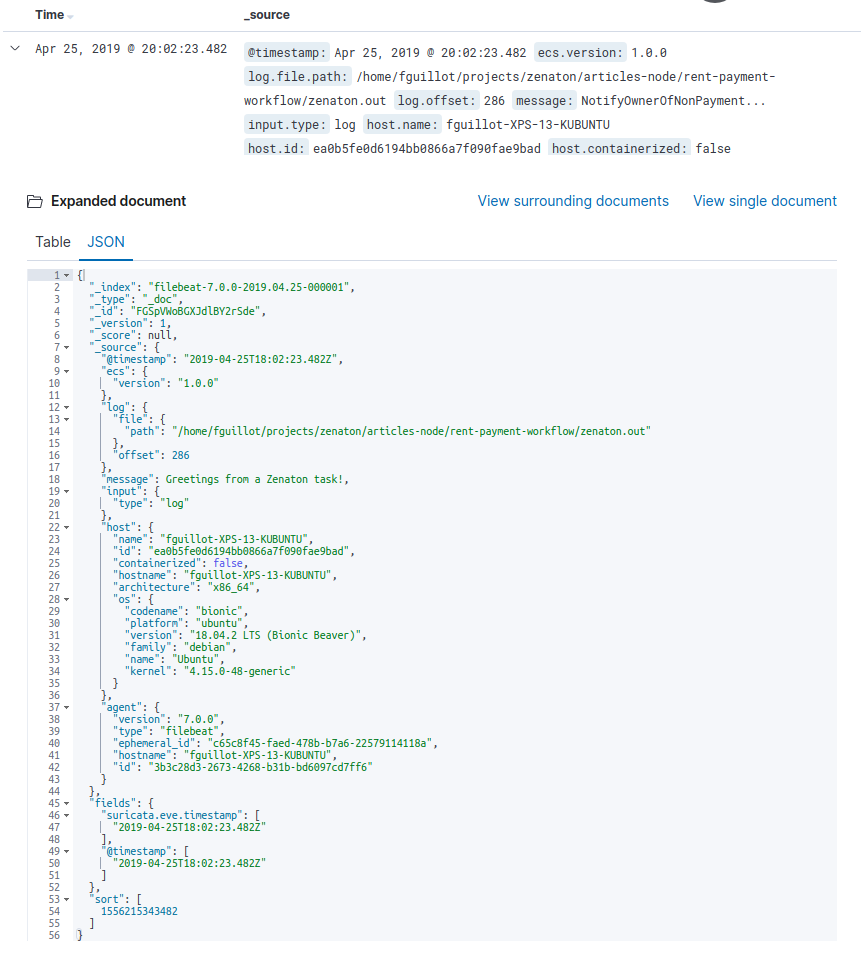
If everything is working, updates made to your Zenaton log files should start to show up in your Kibana dashboard:

Conclusion
Datadog and the ELK stack are two of the most common performance monitoring systems out there, but of course there are many others, and covering them all would be difficult. Most of them propose an out-of-the-box solution to forward log files.
We expect to be able to propose new options to give you an easy access to your Zenaton log files in the foreseeable future. If you have ideas, make sure to share them with as building software that makes our customers successful is our top priority.
Don’t hesitate to reach out to the Zenaton team if you encounter any difficulty setting up Zenaton with any other third party system. We’re always glad to lend a hand.
